
Dashboard
To select the Date Range and Widget visibility, use the dropdown options at the top of the Dashboard page.


If you would like to print one of the Dashboard Widgets, click on the printer icon in the top right hand corner of that widget.
If you would like to rearrange your dashboard, click on the 'Arrow' icon in the top right hand corner of the widget, and you can drop and drag it to the new position.
Dashboard Widgets Explained:
Stakeholder Counts - Displays the total number of Stakeholders (Individual, Organization and Total), Interactions and Tasks for that Date Range

Top 5 Interaction Methods - Displays a chart of the Top 5 Interaction methods and the number of Interactions for the selected Date Range

Interaction Tag Counts for Date Range - Displays the number of Interactions that are tagged/not tagged for that date range, as well as the the number of Tags that have been assigned to a category or not.

Stakeholders with Activity for Date Range - Displays a list of stakeholders that have activity(Interactions or Tasks) during the selected Date Range.

Stakeholder Mapping - Displays Stakeholder mapping filters in a pie chart for all the mapped Stakeholders. You can drill into each section of the chart to populate and export the list of those stakeholders.

Stakeholder Engagement for Date Range by Mapping Values - Displays the engagement level with stakeholders by their mapping value and type. You can drill into each section of the chart to populate and export the list of those stakeholders who have had engagement and those that have not.

Stakeholder Mapping Scattergram – Displays the number of Stakeholders determined by mapping value in a Scattergram style chart.

Contact Group Engagement Values for Date Range - Displays the number of stakeholders that have had engagement or not, and by which method, in the selected date range. This can be filtered by Contact Group on the widget as well as engagement or not.


Interaction Sentiment for Top 5 Tag Category for Date Range - Displays a chart of the top 5 Tag Categories and what sentiment value they have. You can drill into each section of the chart to populate and export the list of Interactions for each level of sentiment.

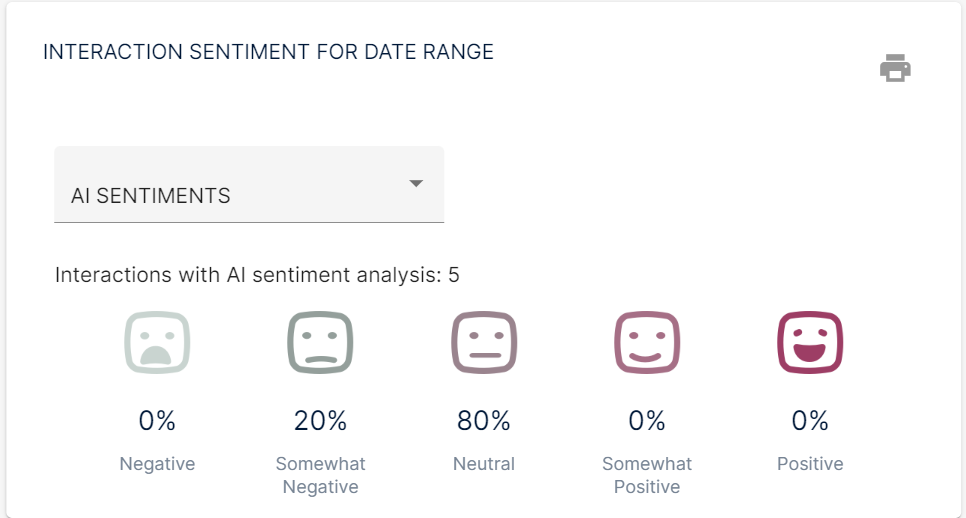
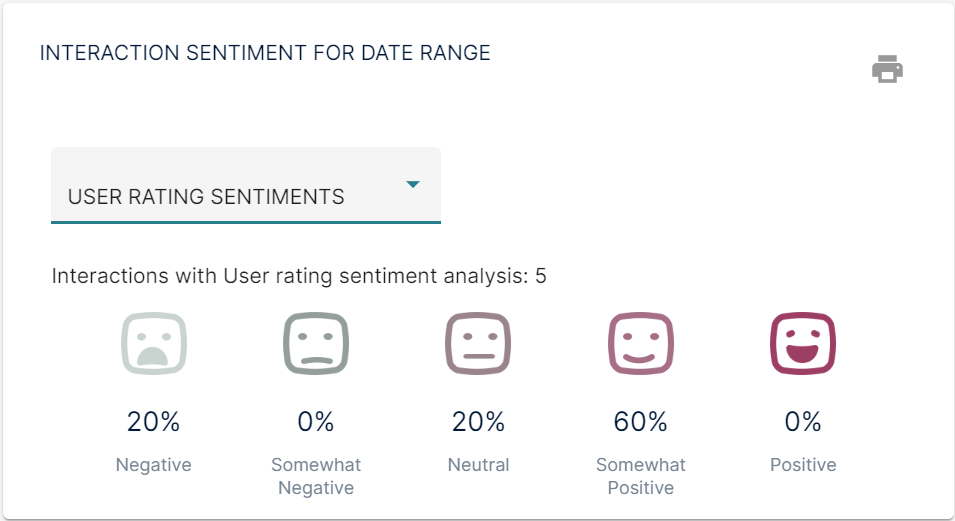
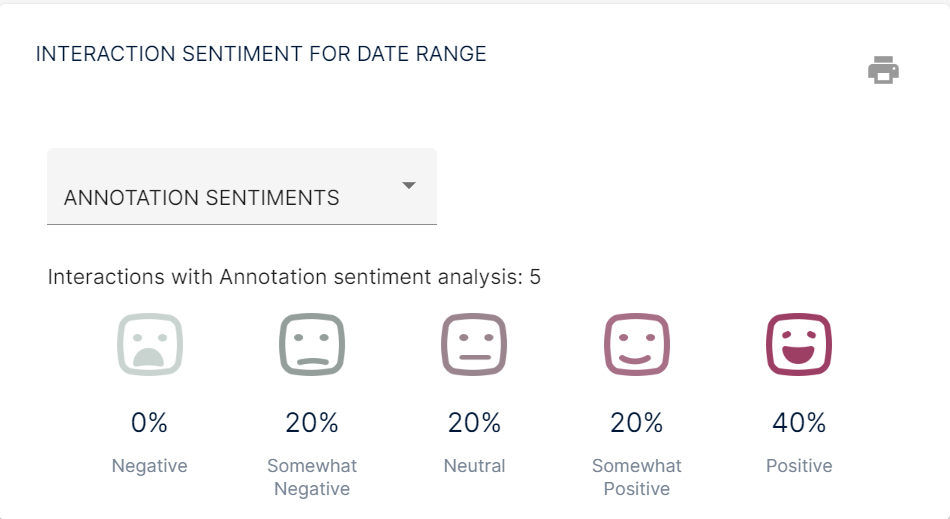
Interaction Sentiment For Date Range - This widget displays sentiment across the 3 sentiments based on AI, User Rating and Annotations.
Tasks (Open / Waiting) - Displays a list of tasks based on the selected 'Date Range'. The 'Users', 'Task Board' and 'Overdue Only' status can be modified / filtered on the widget.

Group Mail Invitations for Date Range - Displays a list of GroupMail invitations that have been sent for the selected Date Range
